Rivière des Prairies
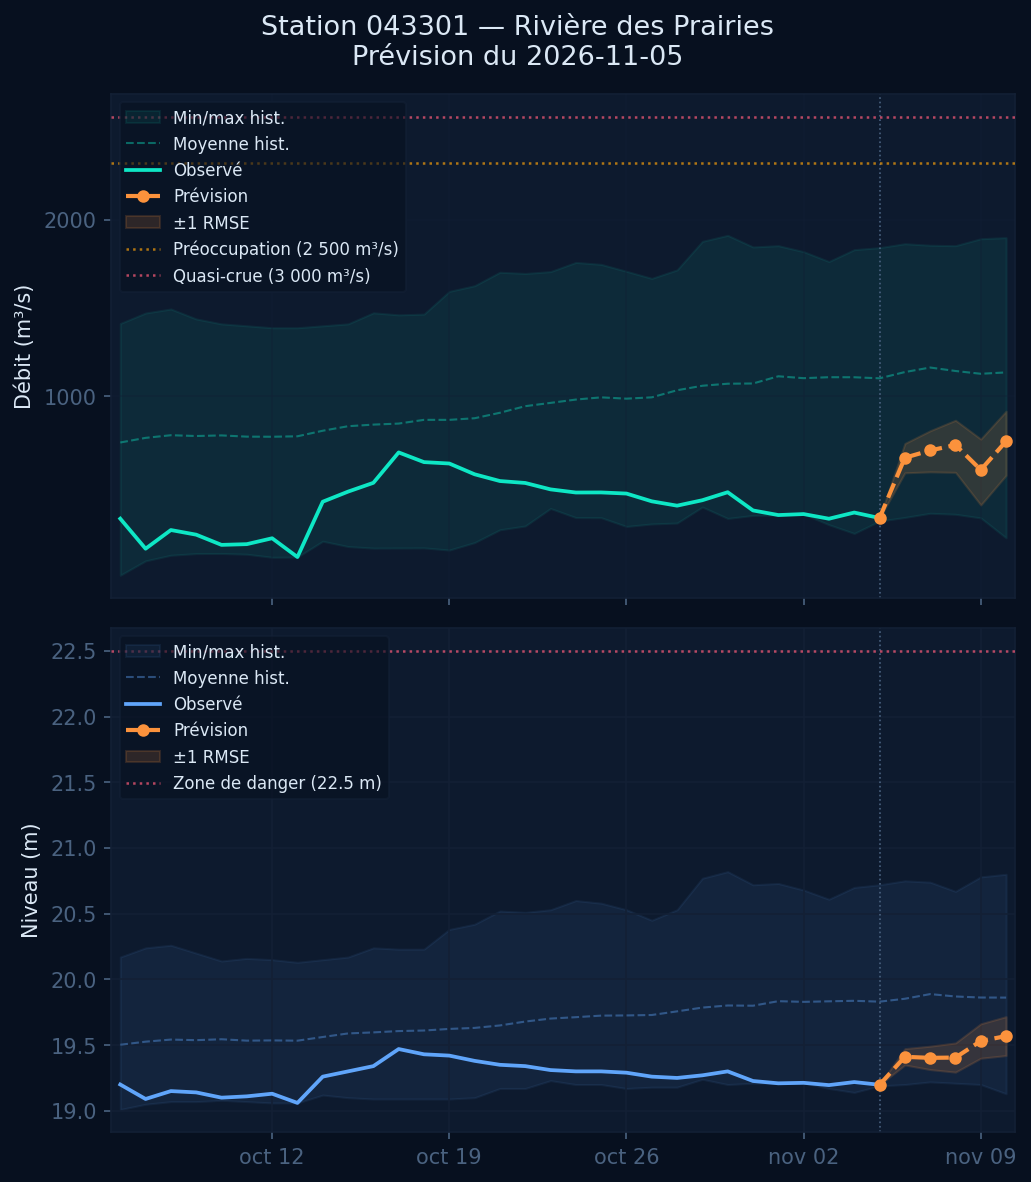
5-day hydrological forecast
—
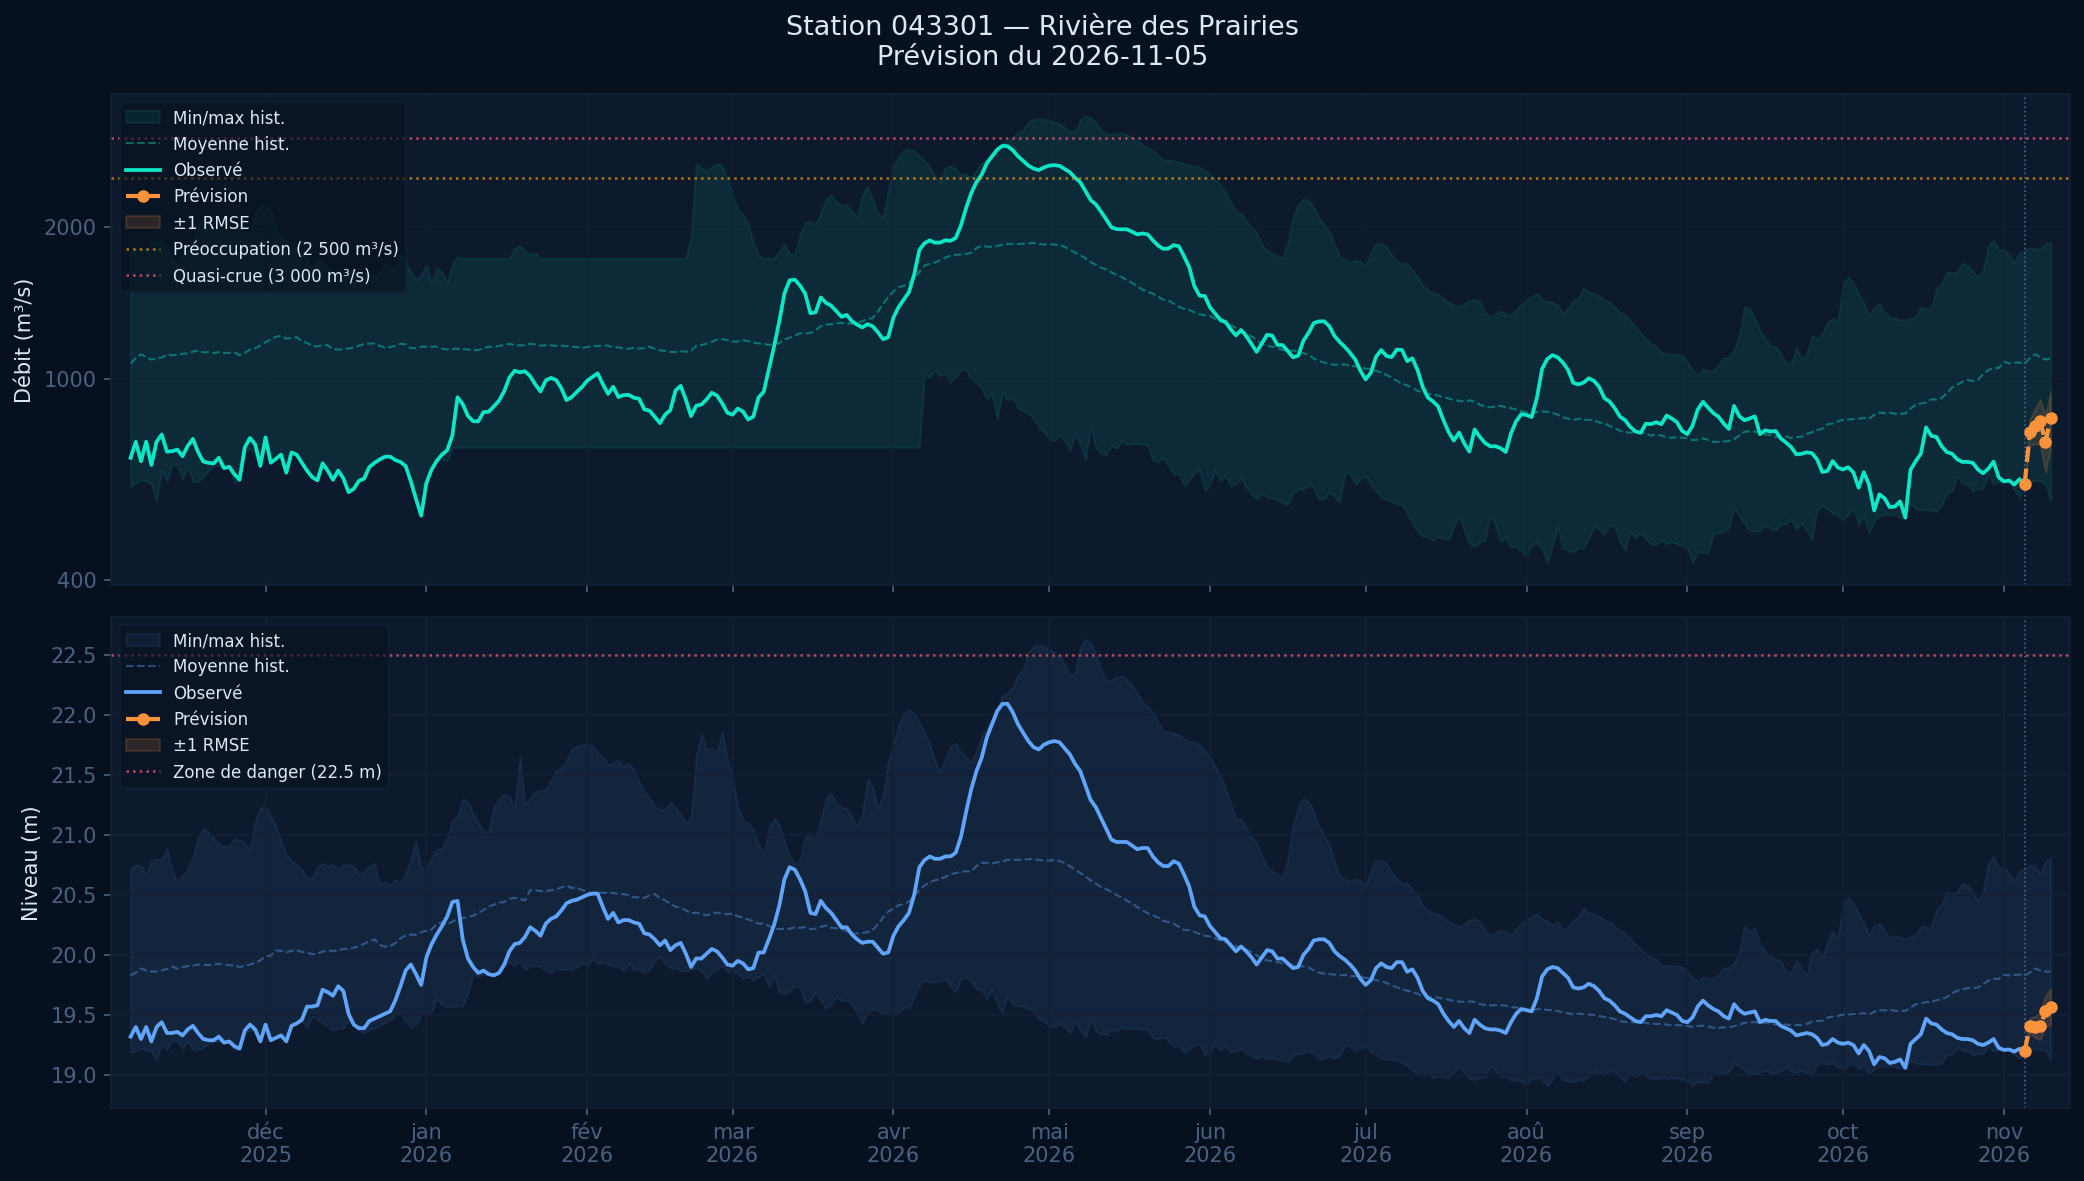
This site displays a 5-day forecast of the water flow and level of the Rivière des Prairies, at hydrometric station 043301 in Laval, Québec.
A machine-learning model (LightGBM) is trained on more than 45 years of historical data from five hydrological stations in Québec and Ontario, combined with climate data (temperature, precipitation, snow). At forecast time, the predicted weather for the next 5 days is injected into the model to produce the displayed values.
The forecast is updated automatically twice a day.
Loading…
↗ click to zoom
↗ click to zoom
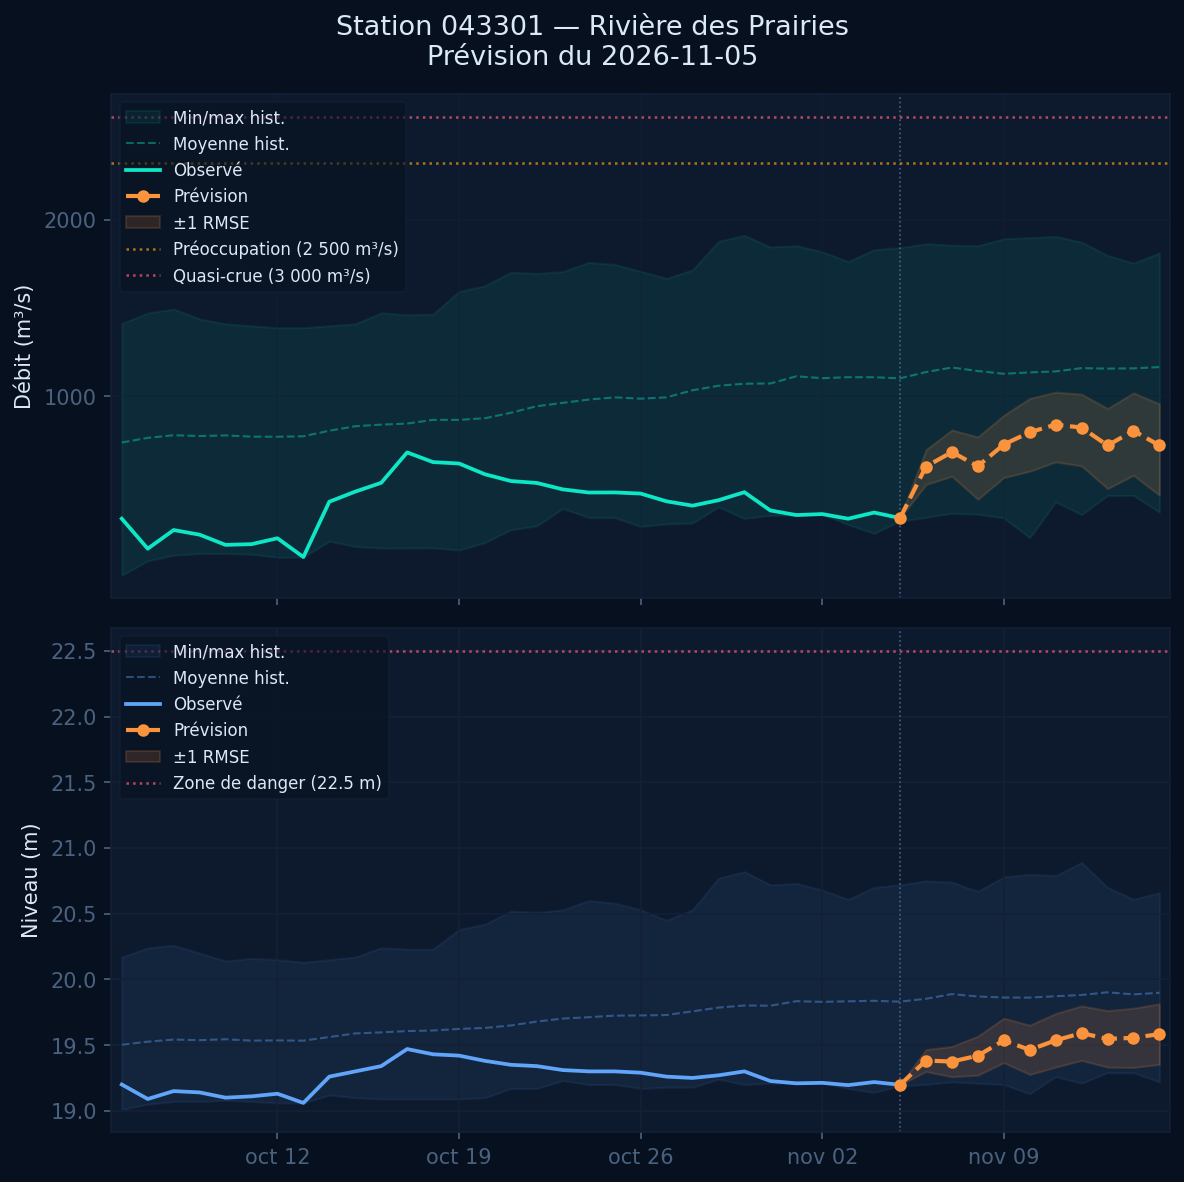
- Solid lineObserved values (station historical data)
- Dashed line with circlesModel forecast for the next 5 days
- Shaded bandTypical model error margin (±1 RMSE)
- Dashed line + grey bandHistorical mean and min/max envelope
- Vertical lineDate of the last observation (start of the forecast)
- Orange line (2,500 m³/s)Concern threshold
- Red line (3,000 m³/s / 22.5 m)Near-flood threshold / danger zone
Alternative model that extends the forecast to 10 days. Same inputs as the main forecast, but trained to optimize flood detection across 10 horizons. Accuracy decreases with horizon — days 6–10 are provided for reference only.
Loading…
This project is a simple experiment created to familiarize myself with Claude Code. No data or method used here is considered to be valid, functional, or accurate.
The data in this repository and the data produced by the tools cannot be used for any planning or decision-making purpose related to the river level. The author disclaims all responsibility for the use of this data.
—Laurent